Data Model Design and Best Practices: Part 2
What is a Data Model? As Talend developers, we see them every day, and we think we know what they are:
- A structural definition of a business system data
- A graphical representation of business data
- A data foundation upon which to build business solutions
These may all be true statements, but for a moment let me suggest that they are all extraneous definitions; peripheral because separately they do not reach to the root or purpose, or the goal of what a Data Model really is.
Ok then, what IS a Data Model? I think it is many things, and yet, a specific thing. For me a Data Model is the structural foundation, represented as a well-defined graphical characterization of a business information system. What do you think? That’s the same as the definitions above, right? Not really. This definition encompasses all the elements into a single purpose; a means to identify, structurally, information about a business use case, not just its data.
In Part 1 of this blog series, I condensed a 50-year history of Data Modeling into about 4 short paragraphs. Sure, I left out a few bits, but I do believe understanding how we arrived at what we know and do about data modeling is a result of lessons learned and improvements achieved from our predecessors. Today most companies use data models to help validate requirements, a true business value, but I often wonder if they understand how to do it right. In many cases, the illusion of a durable data model is presumed by the mere fact that there is one, without knowing or validating for sure if it is right.
As a practitioner of Data Architecture and Database Design, I have seen so many bad data models that I am compelled to suggest that most data models are probably wrong to some extent. I have seen many good ones, yet, how do you know if a data model is good or bad? Why should we care? So long as data gets into and out of it, isn’t that good enough? The answer is a resounding, NO! Data Models must be good, or great, to ensure the success of the business systems running against and/or in cooperation with them. The Data Model is the essence of the business and therefore must be comprehensive, unimpeachable, and resilient.
The motivation of having a good data model is therefore apparent. Once you begin putting data in and getting data out with ETL/ELT tools like Talend Studio, this becomes clear (to most of us). I think a Data Model is one of three essential technical elements of any software project. The other two being the Application Code and the User Interface.
Ok, so you also read in Part 1 about the Database Development Life Cycle (DDLC) methodology for which every data model I design follows. This methodology has served me well and is highly recommended for any serious database development team. Understanding and adopting this process can streamline, automate, and improve any implementation and maintenance of a data model. Yet, there is more to this process which we need to explore. Let me share some additional best practices that can promote a reliable, pliable, and accurate Data Model for your business.
Data Modeling Best Practices
Many data models are designed using a process where the modeler creates a Logical and then a Physical model. Typically, logical models describe entities and attributes and the relationships that bind them providing a clear representation of the business purpose of the data. Physical models then implement the Logical model as tables, columns, datatypes, and indexes along with concise data integrity rules. These rules define primary and foreign keys and default values. Additionally, views, triggers, and stored procedures can be defined to support the implementation as required. The physical model also defines the storage allocation on disk based upon specific configuration options provided by most host systems (like Oracle, MS SQL Server, MySQL, etc.).
Fair enough, Right? Yet, many times I have been engaged in heated debate over the difference between a Logical model and a Conceptual model. Many suggest to me that they are the same, both presenting entities and attributes of the business data. I couldn’t disagree more! The Conceptual model aims to provide context as to the business understanding of data, not a technical one. All stakeholders can understand a Conceptual model and many struggles with Entities and Attributes. I believe the Conceptual model, done right, is the BEST tool for communication about the business data for everyone involved. I prefer to use aspects of the Unified Modeling Language (UML) as my way to diagram a Conceptual model and to keep it simple, not getting bogged down with details. I’ll leave that for the Logical and Physical models in which those details are essential and refined.
The Enterprise Business, usually having large numbers of application systems, introduces a higher level of concern when modeling data. I have found that even the Conceptual, Logical, and Physical models are simply not enough. Introducing: The Holistic Data Model; or at least my adaptation of it!
The intent of the Holistic Data Model is to identify and abstract data silos across a business enterprise, thus describing what exists or is needed, where they relate to each other, and how to organize them for the most effective use, at the highest level.
The 4 Data Modeling Process Layers
Given the potential for 4 different types of data models in an enterprise, I propose the following data modeling process to be followed as ‘Layers’, top-down, for the definition, refinement of understanding, and specific design features. Key roles in each level identify who and where they become involved in the process.
Holistic Data Model:
The Holistic Layer represents an abstract landscape of data silos across an enterprise. This data model creates the opportunity to establish widespread business data governance thus enabling a better understanding of all data relationships inherent to the enterprise. They are intended to incorporate data from any application, Internal or External. I use a Bubble Chart to diagram the Holistic Data model. Here is how I do it:
Bubble Charts – Data Silos


Sometimes a bubble is surrounded by a larger bubble. These larger bubbles signify that an Ontology exists (or should) organizing a Taxonomy specific to that data silo. Ontologies and their taxonomy metadata provide meaningful mappings to the silo it wraps around. This is very useful for making data highly searchable and should be identified in this layer.

Here is an example of what a fully defined Holistic Data Model might look like. Print them on the BIG printer and put them up on a wall. Many productive conversations can be had examining these and become an effective, valuable asset to your business.
Conceptual Data Model:
UML Information Architecture
Each element object encapsulates a particular part of a data silo and connecting lines (also called Links) which define specific relationships between two elements (and again, only two). Particular element items (called characteristics) are defined to further assist in the understanding and purpose of the object. These are either:
- Protected (where values are pre-determined)
- Public (where values are mutable)
- Private (where values have restricted use)
Element Objects connected directly to each other are deemed to have some ‘association’ indicated with a solid GREY link and purposeful labels. These associations, using the diamond symbol on the Parent element, present relationships that are either:
- Simple (no diamond)
- Shared (open diamond)
- Composite (solid diamond)
A child element may also be ‘navigatable’ indicated by an arrow symbol further identified with a relational cardinality (0.* = zero to many, etc.).
Element objects can also have ‘generalizations’, which is to say that an instance of an object may have some particular or unique characteristics and/or relationships. In this representation, the object is more like a sub-class of one parent element including all of its characteristics PLUS any additional unique characteristics involved. The sub-class element is refined in both its name and its representation to provide an understandable refinement on the abstracted holistic data silo. Generalizations connected to element objects are indicated with solid BLUE links having a closed arrow attached to the parent object and no label is required.
Connections between sub-classes further define relationships that are useful in the understanding of the conceptual data model it represents. Generalized sub-classes connected to other generalized sub-classes of the same parent object are deemed to have an ‘association’ indicated with solid GREEN links and purposeful labels. These relationships may optionally be ‘navigatable’ indicated by an open arrow symbol then further identified with a relational a relational cardinality (0.* = zero to many, etc.).
Completing the UML diagram, elements can have self-joining associations which are specific characteristics that extend the definition of a parent object, and/or ‘associations’ between specific characteristics. The specific extensions do not represent a class or a generalization but identify pertinent characteristics that are called out for the purpose of better understanding of the abstracted data silo. The connection of specific characteristics to an element is indicated with a solid RED link and a purposeful label. Additionally, element characteristics can connect to other element characteristics of the same parent object indicated with solid GREEN links similar to related generalizations. These relationships may also be ‘navigatable’ indicated with an optional, open arrow symbol then further identified with a relational cardinality (0.* = zero to many, etc.).
The Conceptual Data Model describes particular data elements using a class-based metaphor, best diagramed using UML, which further explains abstracted holistic data silos. This objective is to define, refine, and mitigate business information, still agnostic to any application, implementation rules, or technical details, and also to encapsulate details left out of the holistic model.
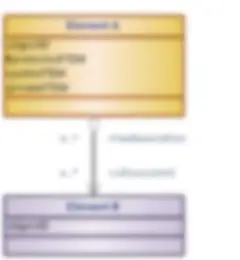
Again, print it out BIG and note that this model represents a common interface against which application code can be written without the logical or physical data models that follow. This advantage can also present a validation point before which those subsequent data models are crafted. Validation of the UML model with both software engineering and stakeholders is a key milestone in the data modeling process. Here is an example of what a selection of a Conceptual Data Model might look like.
Note that this model has ‘Sub Elements’ which define particular aspects of the ‘Main Element’ clarifying unique and recurring characteristics.
Logical Data Model:
The Logical Layer represents an abstract structure of semantic information organized in terms of domain entities (logical data objects), their attributes, and specific relationships between them. This data model derived from element objects of the Conceptual model, define pertinent details (keys/attributes) plus relationships between entities without regard to any specific host storage technology. Entities can represent a single element, part of an element, or multiple elements as necessary to encapsulate suitable data structures. The Logical Data Model encapsulates the structural entities and record sets identified in the Conceptual Model adding specific attributes thus enabling a better understanding of the data involved. Here is how I do it:
ERD
Entity Relationship Diagrams or ERD’s, describe uniquely identifiable entities capable of independent existence which in turn require a minimal set of unique identifying attribute called a Primary Key (PK). Where a child entity is linked to some parent entity, referential data integrity can and should be enforced through the use of an identifying attribute in the child entity that matches the parents Primary Key attribute(s) called a Foreign Key (FK). But then you all know about these.
Where appropriate, entities may be linked together demonstrating the nature of a record set, or the cardinality relationship between two or more entities. Entities with links can utilize the Crow’s Foot Notation technique widely adopted for entity relationship diagrams (ERD’s). Indicated by solid BLUE links, the appropriate crow’s foot notation on both sides should also include a purposeful label to describe the record set it represents. These entity links present specific cardinality explaining the allowable record counts of a record set. These notations specify either: zero, one, or many rows or some compulsory combination.
Cardinality has only two rules: the minimum and maximum number of rows for each entity that can participate in a relationship where the notation closest to the entity is the maximum count. Specifying cardinality for a record set also suggests that the relationship is optional or mandatory which assists with the design for the physical data model.
An ERD can support links to multiple entities including self-joining links. Entities should also not be confused as tables however often can map directly to tables in a physical data model (see below). Instead logical entities are structural abstractions that focus on streamlined representations from the conceptual data model.
The logical data model presents the semantic abstraction of the conceptual data model providing details from which a physical data model can be designed. This advantage can also assist both application services engineers and database engineers with a basis for understanding not only the abstracted data structure but the requirements for data transactions. Here is an example of what a selection of a Logical Data Model might look like.
Notice a few things here. I’ve used colors to represent different functional areas which can map up to the Conceptual and Holistic models. I’ve also incorporated a ‘Virtual’ relationship between ENTITY_D and ENTITY_C (shown as a LIGHT GREY link). This identifies that a logical relationship exists however the construct between these two entities plus ENTITY_B represents a ‘circular reference’ which is something to avoid completely in the physical model. Also note that there are a few attributes that define an array of values. In the logical model this is OK as it simplifies and streamlines the model; just be sure to normalize them in the physical model.
Physical Data Model:
The Physical Layer represents a composition of host system artifacts (physical data objects) derived from a logical data model coupled with its desired storage configuration. This data model incorporates Tables, Columns, Data Types, Keys, Constraints, Permissions, Indexes, Views, and details on the allocation parameters available on the data store (see my blog on Beyond the Data Vault for more on data stores). These host artifacts represent the actual data model upon which software applications are built. The Physical Data Model encapsulates all these artifacts from entities and attributes defined in the Logical Data mode finally enabling an application access to store and retrieve actual data. Here is how I do it:
SDM
A Schema (Physical) Design Model or SDM defines specific objects involved in a database information system. I will presume that most of my readers know more about this data model than the previous three, so I’ll avoid describing the constructs. I prefer calling it an SDM so that it is not confused by the more widely used term ERD which is NOT a physical data model. Instead the SDM provides an engineering reference often chronicled with both the graphical diagram and a Data Dictionary document. Providing a critical, detailed reference to every database object implemented in the SDM, this document should incorporate their purpose, referential integrity rules, and other important information on any intended behavior. Here is a good structure that I use:
- Object Name & Definition (Tables / Views)
- SQL object creation/modification filename
- Business Domain & Functional Utilization
- Version / Integrity Level
- Columns / Datatypes / Size
- Nullability
- Default Values
- Primary Keys
- Foreign Keys
- Natural Business Keys
- Unique Constraints
- Check Constraints
- Unique & Non-Unique Indexes (Clustered & Non-Clustered)
- Control Flows (when extra complexity design/use is involved)
- Useful Comments
- Change History
An SDM Data Dictionary references objects alphabetically by name for ease of use. As most physical data models are highly normalized (did you read Part 1 in this series), referential integrity rules should be called out for each table. In my experience I have seen many ways to deal with these rules, in particular when executing SQL object scripts against an existing schema. Simply turning off integrity checks, running the scripts then turning it back on works; Easy enough, but I am not a fan of this method as it is prone to errors.
Instead I take the time to understand particular references to all tables and assign a level of integrity for each. A table ‘Integrity Level’ identifies the hierarchical ordering of parent/child table relationship. In short, a table ‘Integrity Level’ is based upon any Foreign Key reference to parent table(s). For example:
- A table with no parent tables: is a L0 - or level 0 (highest level)
- A table with at least one parent table: is a L1 or level 1
- A table with at least one parent table but that parent table has a L0 parent table: is a L2 or level 2
- A table with multiple parent tables having parent tables of different levels, use the is the lowest level +1
- ie: parent A is an L0, parent B is an L1, so child table is an L2 or: parent A is an L1, parent B is an L4, so the child table is an L5
- and so on
NOTE: L0 is the highest level as there are no parent tables; the lowest level is determined by the physical data model. This method also eliminates the potential for the creation of circular references (a bad data model design practice IMHO).
The physical data model is the one model that is actually implemented. I prefer to use SQL object creation scripts, or SOCS for this implmentation. Using this method I discovered that the DDLC for any physical data model can be decoupled as an indepentent process which is highly desirable and difficult to achieve. The idea is to create one SOCS file for one primary database object (Table, View, Trigger, or Stored Procedure). These scripts contain intelligent checks to determine which SQL statements to apply (drop, create, alter, etc) and can, through switches and arguments passed in account for the life cycle discussed in my previous blog, whice are:
- A Fresh INSTALL based upon the current version of the schema
- Apply an UPGRADE drop/create/alter dB objects upgrading one version to the next
- Data MIGRATION where a disruptive ‘upgrade’ occurs (like splitting tables or platform)
These SOCS files incorporate best practices as well which include (yours may differ):
- Consistent Naming Conventions
- Table Names all CAPS
- Column Names all LOWER CASE
- View Names all Camel Case
- SOCS file names incorporate Object Name
- Single Column Primary Keys using appropriate sized Integers
- Elimination of Redundant/Duplicate data (tuples)
- Elimination of all Circular Key References (where a Parent > Child > Parent may occur)
- Single SOCS File per Object
- SOCS files contain consistent header/purpose/history sections matching this data dictionary
- SQL formatting provides readability & maintainability
Further details on my implementation of SOCS is outside the scope of this blog. Maybe I can be persuaded to write about this another time. Your feedback and questions is welcome.
Wherefore art thou Data Model?
A brief summary of these layers assists in understanding their purpose, how they support and differ from each other in the modeling process. Take a look at this table to see:
| DATA MODEL ASPECT | HOLISTIC | CONCEPTUAL | LOGICAL | PHYSICAL |
|---|---|---|---|---|
| Data silos | √ | |||
| Data silo relationships | √ | |||
| Element names | √ | |||
| Element relationships | √ | |||
| Element generalizations | √ | |||
| Element items | √ | |||
| Entity names | √ | |||
| Entity relationships | √ | |||
| Entity keys | √ | |||
| Entity attributes | √ | |||
| Entity constraints | √ | |||
| Table / View names | √ | |||
| Column names | √ | |||
| Column data types | √ | |||
| Column default values | √ | |||
| Primary / Foreign keys | √ | |||
| Index names | √ | |||
| Index properties | √ | |||
| Storage configurations | √ |
Conclusion
Well I thank you for getting through all of this, and you know who you are if you’ve reached this point in the blog. Good news is that about covers it! YEA! Hopefully this has been helpful information and when good Talend Developers know their data models, job design patterns and best practices emerge. If you haven’t read my blogs on that topic yet here is the link to Part 4. You’ll find links to Part 1-2-3 inside. You might also find the blog on Building a Governed Data Lake in the Cloud interesting, written jointly by yours truly and my good friend Kent Graziano of Snowflake Computing, a valued Talend partner.